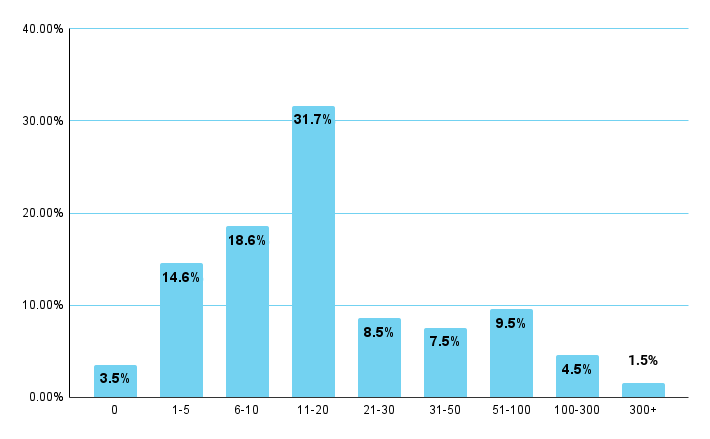
199 journals completed the survey, most of which are relatively small in terms of the output: most journals (129; 64.8%) published up to 20 articles and over one third (63; 31.7%) published 11–20 articles in 2023.
| # articles published in 2023 | # journals | % journals |
|---|---|---|
| 0 | 7 | 3.5% |
| 1-5 | 29 | 14.6% |
| 6-10 | 37 | 18.6% |
| 11-20 | 63 | 31.7% |
| 21-30 | 17 | 8.5% |
| 31-50 | 15 | 7.5% |
| 51-100 | 19 | 9.5% |
| 100-300 | 9 | 4.5% |
| more than 300 | 3 | 1.5% |
| Total | 199 | 100.0% |
Note: Most respondents provided absolute numbers, which were coded into ranges to make it easier to read the data.
Figure 1. The size of journals measured by the number of articles published in 2023
199 respondents represent/cover all disciplines. Most journals are either multidisciplinary or cover more than one discipline (55.3%). Medical and health sciences (14.6%) and Social sciences (15.1%) journals are the most numerous among single-discipline journals. The distribution of the respondents across major disciplinary clusters shows that Social sciences and Humanities (SSH; 31.7%) journals are slightly better represented in the sample than STEM (Science, Technology, Engineering and Mathematics; 28.1%). The remaining 40.2%, grouped under the ‘multidisciplinary’ label include journals that cover both SSH and STEM topics.
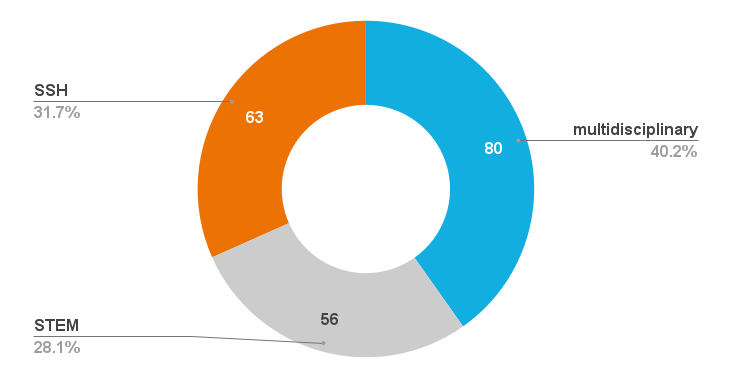
Figure 2. The distribution of journals across major disciplinary clusters
Table 1. The distribution of journals across disciplines
| Disciplines | # journals | % journals |
|---|---|---|
| Multidisciplinary or multiple disciplines | 110 | 55.3% |
| Natural sciences | 4 | 2.0% |
| Engineering and technology | 7 | 3.5% |
| Medical and health sciences | 29 | 14.6% |
| Agricultural sciences | 4 | 2.0% |
| Social sciences | 30 | 15.1% |
| Humanities | 15 | 7.5% |
| Total | 199 | 100.0% |
More than 40% of the respondents have small editorial teams (excluding Editorial boards) comprising one to five people (groups less than 2 and 2–5), while 5% do not have any editorial team members. More than one fifth (22.1%) have 6–10 people and the share of those having 11–20 people is still not insignificant (15.6%). The journals with more than 20 team members (groups 21–30 and more than 30) account for 13.3%.1
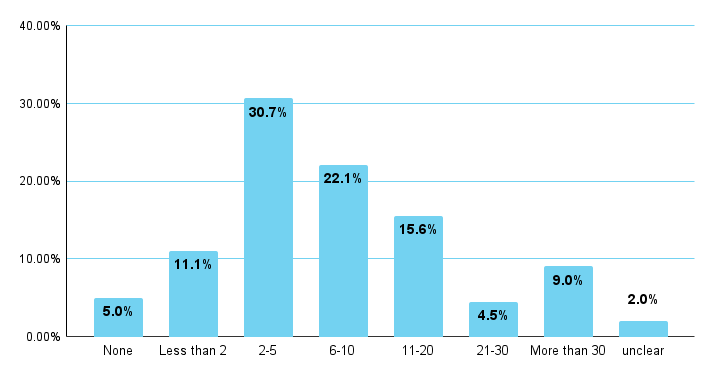
Figure 3. The number of people working for a journal in any capacity (excluding the Editorial boards)
About 60% of the respondents rely on volunteer work fully or partially. Although 30.2% of them have a dedicated unit responsible for publishing with employed staff, 16.6% still rely on volunteer work.
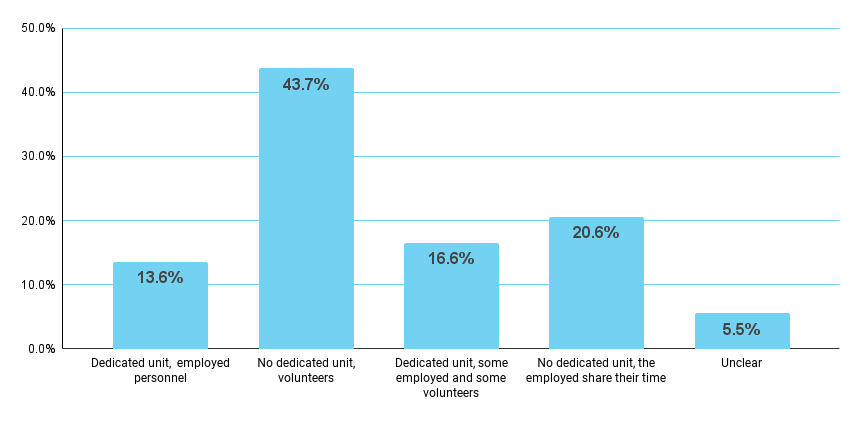
| How does your journal’s personnel work? | # journals | % journals |
|---|---|---|
| Dedicated unit with personnel fully or partially employed to work for the journal | 27 | 13.6% |
| No dedicated unit and everyone is working as volunteers | 87 | 43.7% |
| Dedicated unit responsible for the journal with some personnel employed and some volunteers | 33 | 16.6% |
| No dedicated unit, but personnel employed by the institution is sharing their time | 41 | 20.6% |
| Unclear | 11 | 5.5% |
| Total | 199 | 100.0% |
Figure 4. The reliance of journals on the employed personnel and volunteers
Interestingly, a comparison with data relating to staff size shows that those with 2–5 team members (38 of 61) and those with more than 30 team members (10 of 18) predominantly rely on volunteer work, either fully or partially.
1 The ‘unclear’ group includes those journals that submitted duplicate responses providing inconsistent information.